|
|
"To us
all towns are one, all men our kin. |

| Home | Whats New | Trans State Nation | One World | Unfolding Consciousness | Comments | Search |
|
|
"To us
all towns are one, all men our kin. |
| Home | Whats New | Trans State Nation | One World | Unfolding Consciousness | Comments | Search |
Home > Tamils - a Trans State Nation > The Tamil Heritage > Culture of the Tamils > First International Tamil Conference Seminar > The Geographical Distribution, Demographic Characteristics and Mobility Trends of the Ceylon-Tamil Community with Special Reference to the Urban Areas of Ceylon - B. L. Panditharatne
|
First International Tamil Conference - Seminar The Geographical Distribution, [see also Tamil Heritage - Tamils are an Ancient People ] B. L. Panditharatne I. General Aspects The Ceylon-Tamil community' popularly referred to as the ' Jaffna-Tamils' is differentiated from the other Tamil speaking communities2 namely, the Indian-Tamils, the Indian-Moors3 and the Ceylon-Muslims. The Jaffna-Tamils have been, and still are scattered in distribution all over Ceylon. But, they predominate in numbers in the Northern and Eastern Provinces. Their distribution, however tends to be markedly urban in the Sinhalese predominant provinces. The Ceylon-Tamil community constitutes about eleven percent. of the total population, and ranks as the third largest community.4 Table 1
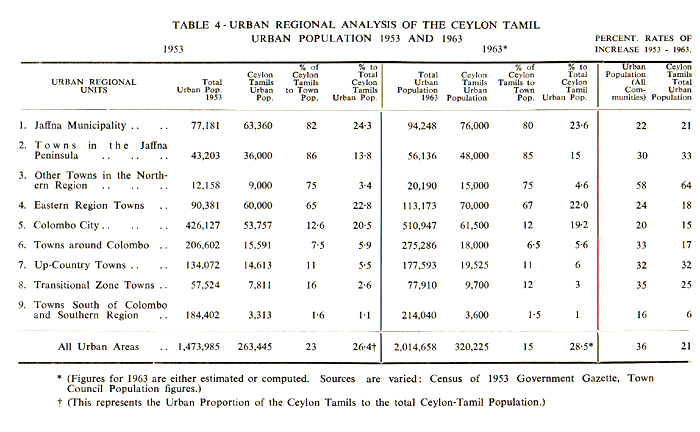
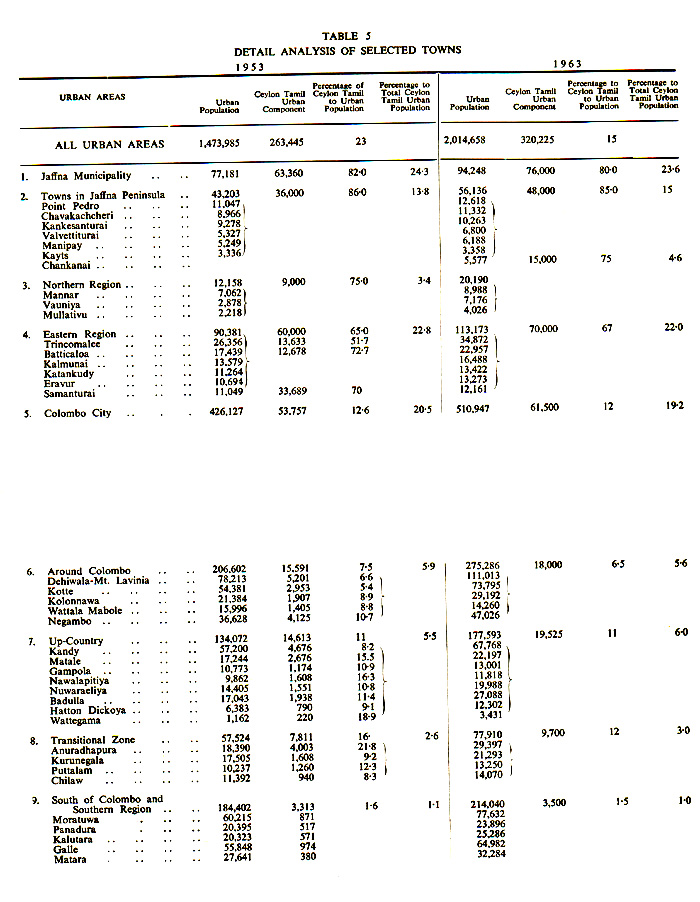
The community almost doubled in numbers since the 1911 Census.5 In 1963, it was estimated about 1,122,700. Although the numbers increased, the representative percentage to the total population in fact decreased from 12.86 to 11 per cent. Until 1953, the percentage rates of increase of this community were lower than the average rate of Ceylon. For instance, during the intercensal period 1946-1953, the KandyanSinhalese, Ceylon-Muslims and Indian-Moors showed a higher percentage rate of increase than Ceylon's average rate of 21.6 per cent. Since 1953, both Ceylon's and the Ceylon-Tamil community's rates were almost similar. According to the 1953 Census, 699,005 or 84.7 per cent. of the Ceylon-Tamil community was rural in distribution, and 188,988 or 15.3 per cent. urban. But, the Census had excluded the population of the town councils. When these numbers were added, the Ceylon-Tamil urban population totalled 263,445 and raised the urban ratio to 26.4 per cent. In 1963, the Ceylon-Tamil urban population was estimated at about 320,225 which showed a computed urban ratio of 28.5 per cent. The total urban population of Ceylon increased from 1,473,985 in 1953 to 2,014,658 in 1963, and recorded an increase of 36 per cent. But the urban population of Ceylon-Tamils increased by only 21 per cent. during the same period. Thus the percentage of the total urban Ceylon-Tamils to the total urban population of Ceylon decreased from 23 per cent. in 1953 to 15 per cent. in 1963. In 1963,6 about 28.5 per cent. of the Ceylon-Tamils lived in urban areas. The physical compactness of the Jaffna Peninsula, its small size, its developed network of roads and railways, an urban-rural integrated bus service, all have been favourable in the rapid urbanization of the Peninsula. In addition to the officially recognized towns,7 there were a number of junction-centers whose institutional and urban equipment have grown and developed and these characterized as townships, although these were not as yet up-graded to town status. When the Jaffna-man migrated out from the Peninsula, he seemed to prefer urban occupations such as Government jobs, retail and petty business, small industries, domestic, and personal services and thus live in urban areas. Table 2 shows the geographical distribution of the Ceylon-Tamils in selected districts. The Table is arranged to emphasize the relative percentage of the community to the total district population. In the Jaffna and Vavuniya districts, Ceylon-Tamil population was predominant. In Batticaloa, Mannar and Trincomalee districts, they were in the majority. In the other districts, they were small in numbers and constituted under 10 per cent. of the total district population. In numbers, Colombo district ranked third in position after Jaffna and Batticaloa districts; Kandy fifth after Trincomalee; Anuradhapura and Badulla districts occupied the seventh and eighth places respectively. Urban-Regional Analysis For effective portrayal of the salient aspects of population, demographical, functional and migration trends, the urban distribution of the Ceylon-Tamils is grouped into the following urban units.
Ceylon towns are multi-communal in composition, comprising of the Sinhalese, Ceylon-Tamils, Indian-Tamils, Ceylon-Muslims, Indian-Moors, Eurasians (Burghers), the Europeans and others. In Jaffna city, (Municipality) the other towns in the Jaffna Peninsula, the towns in the Northern Region, Ceylon-Tamils were predominant. Table 2
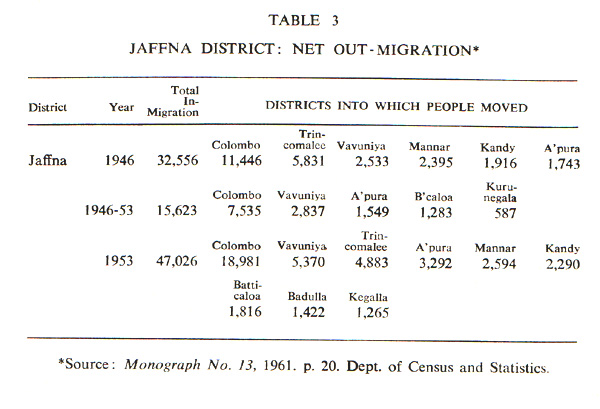
Sources: Census of Ceylon, 1953. *(For selected districts only) In Batticaloa, Trincomalee and the other towns in the Eastern Region, the community was predominant to dominant intermixed with Ceylon-Muslims, Indian-Tamils and the Sinhalese. In Wattegama, Nawalapitiya, Matale, the percentage of Ceylon-Tamils was significant, although the Sinhalese were in the majority. In Colombo, Badulla, Nuwara-Eliya, Puttalam and Negombo, the community constituted more than 10 per cent. In the other towns, except those of the Southern Region, the community was considerable and economically effective. In the Southern towns, they comprised of a small group only among the predominant Sinhalese. 1. THE JAFFNA CITY, (MUNICIPALITY) THE CORE AREA The Jaffna city is the core of the settlement complex of the Jaffna Peninsula. Nallur, its historic nucleus is no longer the functional core, but only a constituent ward. The functional core is the Fort, associated with historic traditions of the colonial era, and continues to function as the administrative centre for the entire Northern Province because of inertia and momentum, and its nodal position in the Peninsula. The city covers an area of 7.75 square miles or 4,960 acres and is divided into 17 wards (Fig 2). The population of the Jaffna district increased from 326,712 in 1911 to 491,849 in 1953, and is estimated about 580,565 in 1963. The increase was largely a natural one, because the district registered a net out-migration total 47,026 in 1953. The net out-migration figures for the Jaffna district are shown in Table 3.
Within the district, the towns recorded fair net in-migration rates. For instance, Jaffna Municipality showed a moderate rate of 6.24, the other Jaffna towns a higher rate, more than 10. The population of Jaffna city increased from 40,441 in 1911 to 94,435 in 1963. It is today the third largest town in Ceylon. About 80 per cent. of its population comprises of Ceylon-Tamils, which is about 23.6 per cent. of the total Ceylon-Tamil urban population. Both the total urban population of Ceylon-Tamils and the urban population in Jaffna city have increased at 22 and 21 per cent. respectively. However, the representative percentage of the community to the total urban population in the city has declined from 82 to 80 per cent. Since 1901, Jaffna city recorded a steady increase of population owing to (a) births exceeding deaths, (b) in-migration to the city from the surrounding areas and the islands, and (c) the influx into the town of South-Indian immigrants. Owing to considerable improvements in public health and sanitary services, the city recorded steady growth rates of 23.4 and 22.4 per cent. for 1946-53 and 1953-63 decades respectively. The death rates were depressed and reached 8.6 per 1000. Even the birth rates which were high (37.8 in 1963) showed a downward trend after 1963.8 The distribution of the city's population was uneven . There were two clusters : — In Central and Northern St. James, north-east Fort, north and east Cathedral wards in which the average density exceeded 50 persons per acre (32,000 per square mile). In eastern Old Mosque, New Mosque and northern Bazaar wards, in which the density was between 30-50 persons for the acre (10,000-32,000 per square mile), Moderate densities between 10-30 persons for the acre (6,400-19,000 per square mile) were found in Station, Koyyathoddam, Kantharmadam and Vannarponnai wards. The other areas namely Colombothurai, Arialai, Nayanmarkadu and Nallur accommodated a population density less than 10 persons per acre. The clustered areas were in the inner-mixed zone, characterized by contiguous one or two-room shops, boutiques, eating places, retail units, small scale industries, residential tenaments intermixed with one-storeyed, or new two-storeyed, institutional buildings and religious edifices with distinctive architectural features. In the absence of a pipe-borne supply of water and sewerage scheme, the siting of houses had been influenced by the availability of drinking water, which was entirely drawn out from the wells.9 The low density housing areas coincided with those areas without good water supplies. The recently constructed pipe-borne water scheme is very likely to scatter the building spread more evenly within the city. The Census on housing in 1953,10 recorded 12,961 households in Jaffna city. 4,495 were one-room and 4,810 were two-room houses. More than 70 per cent. of the households were very small. Amout 60 per cent. of these accommodated three to seven persons in each house. Only 5 per cent. were large, having more than five-rooms. The urban dwellings appeared to be well constructed. Dwellings with bricks, concrete and tiles showed an increase. Jaffna city like most of the South-Indian towns characterized a high masculinity ratio : 115 males to 100 females. There were several reasons for this. Firstly, Jaffna being an administrative cum service centre attracted employment of a large number of males who left their families in the villages for economy reasons. Secondly, a number of South-Indian male immigrants were also employed in various odd jobs in the city. Thirdly, being a centre of education, a large number of male students were boarded in the city boarding schools. If these three groups were excluded, the permanent resident population seemed to be more or less balanced in sex composition. More than half the population, some 41,974 was between 15-54 years in 1953. The city's job prospects for such a large workforce were limited indeed. Large scale unemployment, especially of the younger group (1521 years old) was experienced. About 25 per cent. of the population belonged to the school going group. This indicated the availability of a large number of educational institutions which were responsible in raising the literacy rate to 83.2 per cent. About 20 per cent. of these were also literate in English. About 60 per cent. of the city's population were Hindus in religion; 28 per cent. Christian, 9 per cent. Mohammedan (Islam) and 3 per cent. Buddhist. These adherents of different faiths seemed to have sorted into different sectors. About 80 per cent. of the Hindus were distributed in the eastern, western, and northern sectors; 90 per cent. of the Christians were confined to the southern sector; majority of the Muslims resided in the north-western part of the city. Religions, however do not seem to have broken through caste barriers which hindered social mobility and progress. Religions were adjusted to the local milieu, so that despite their tolerant nature, there were undercurrents of attitudinal differences between religions and even between different groups of the same religion. The opening up of the Hindu temples to all castes was certainly a bold and progressive step which would eventually help to break through the caste barriers and facilitate greater social mixing. The city combined both rural and urban features in economy and occupations. Agriculture, livestock raising and fishing involved 12 per cent. of its population. This contrasted with the typically urban services involving about 35 per cent., mostly in Governmental administration, education and personal services. Commerce, business and trade accounted for 18 per cent.; manufacturing especially in consumer oriented industries, (food, smoke and drinks) and traditional crafts comprised of 11 per cent. Transport engaged about 7 per cent., and 16 per cent. were employed in activities not adequately described.11 Jaffna City, occupied a position of primacy in the urban hierarchy of Northern Ceylon. Because of the larger number, wider range and hierarchical set up of institutional facilities and services, and Governmental departments located in Jaffna, a daily movement of commuting to Jaffna city both from the other towns, villages, and islands facilitated by bus services and the bicycle involved some 60 - 70 thousand people. There was a preponderance of males in employment. This perhaps revealed the persisting conservatism among the Hindus and Muslims that "the woman's place is the home". A unique feature of Jaffna city, and also of the other Jaffna towns was the prevalence of caste and class and consequent segmentalization into 'social areas'. An attempt was made to study the caste composition and geographical spread in the 15 wards of the Jaffna city.12 A strong correlation between caste, occupation and area was shown. For instance : (a) In toddy tapping a large number of tappers (Nallavar and Pallar castes) lived in those areas where a large number of trees were grown, especially in the Cathedral, Koyathoddam and Vannarponnai wards. There were few tappers in the Muslim predominent Old Mosque and New Mosque wards : (b) In the fishing industry, Karawar caste who were mostly Christians (mostly Roman Catholics) predominated, and showed their distribution in the coastal settlements of Karaiyur, Passayur, Navanturai and Colombothurai. The Vellalar and Koviar groups constituted about 46 per cent. and were distributed throughout the city except in the coastal areas and the Muslim wards. Nallavar and Pallar groups constituted about 17 per cent. and were evenly distributed except in New Mosque and Station wards. Karawar 13 constituted about 11 per cent. and Chiviar, 8 per cent.Karavar, Mukuwar and Thimilar castes resided along the coast, mainly in St. James, Cathedral, Koyathoddam and Colombuthurai. Street nomenclature such as Thimila Olungai, Thimila theru Olungai, Kol Olungai, Nattuwa Lane, Cherniya Street, Paraiya Lane, Chiviatheru Olungai, Kusavanmal Olungai, Thachchetheru Lane, Sayakkaratheru Olungai, Thaddatheru Olungai, Coppersmith's Lane, Chetty Street, New Chetty Street, and Carpenter's Lane signified a strong caste flavour. Segmentalization signifying different class levels was reflected in the house types : particularly in respect of house size, size of the house premises, form, building materials used and architectural details. Five types were recognizable. Firstly, the shanty type : one-room, mud-walled, cadjan-roofed, impermanent shacks dotted the coastal areas occupied by the fisherfolk. Second, along the minor road system were located one or two-room, brick and tile dwellings which indicated a measure of domestic financial stability. Third, congested, contiguous, one-room tenements flanked the streets, lanes and by-ways in the inner mixed-zone of the city. These were occupied by the labourer class. Although one person rented one of these, it was shared as a communal lodge. In fact, as many as six to eight persons preferred to be huddled together in these one-room dwellings which were close to their place of work. There were also those rented to families. Invariably owing to kith and kin affiliations, the bread winner supported many dependants who also lived with him. Fourthly, the compact, well constructed cottage type which stood on its own premises with adequate front and backyards was occupied by the middle class, which consisted of Government servants, teachers, pensioners, small businessmen and small land owners. As the middle class multiplied with the spread of education and employment prospects, so were the cottages, and these sprawled along the circulatory systems. Fifthly, the rare, isolated, solidly constructed first class houses and mansions with large and well laid-out premises occupied by the Government high executives, rich businessmen and landed proprietors. 2. THE OTHER TOWNS IN THE JAFFNA PENINSULA Point Pedro, Chavakachcheri, Kankesanturai, Valvettithurai, Manippay, Kayts, Chankanai have been upgraded to town council status. Many junction centres such as Chunnakam, Tellippalai, Vaddukkoddai, Achchuvali, Kopay, Kodikamam and Velana, although they have developed urban equipment so characteristic of townships have not as yet been upgraded to town status. The recognised group of towns showed a growth rate of 33 per cent. which was higher than that of Jaffna city. The increasing socio-economic importance of these towns and urban development were tied with the upgrading of their institutional equipment. For instance, these towns possessed well staffed and well equipped schools comparable to those in Jaffna city. The hospitals, clinics, post offices, sub-offices of banks, cinema halls catered directly to their resident population. When these institutions were not able to render the services demanded, it was most natural to look to Jaffna which was a mere hour's drive from these towns. Besides, these towns were fast growing as dormitory towns in preference to Jaffna14 because of cheaper land, availability of urban utilities and facilities in them, easy purchase of farm produce, and also because these combined the advantages of proximity to Jaffna city and the relative peaceful atmosphere of being located in sub-urban or rural surroundings. In these towns, the core area coincided with the junction-centre, where the streets were flanked by contiguous one-room shops and boutiques interspersed with new one-storey hotels or institutional buildings. Schools, hospital, post office, kovil, mosque or church, cinema hall or club catered to the socio-civic aspects. A loosely built-up residential outer-zone surrounded the core. Agricultural land use was prominent even within the town limits, and gave it an essentially rural outlook. There was plenty of buildable land for residences. 3. THE TOWNS IN THE NORTHERN REGION (NORTH-WEST COAST AND VANNI COUNTRY) The towns of Mannar, Vavuniya and Mullaitivu, the recognised town councils of the Northern Region recorded a very high growth rate of 64 per cent., the highest in urban Ceylon for the 1953-1963 decade. Other towns such as Kilinochchi, Paranthan, Mankulam and Murunkan, although not as yet upgraded to town status grew rapidly. Town growth was mostly tied with in-migrants and settlement within them, coupled with the natural increase. These towns functioned as service centres for their extensive but fast developing urban fields. The development of agriculture and irrigation, land alienation, colonisation and village expansion, all favourably impacted on town growth. The in-migrants who settled in these towns were mostly Ceylon-Tamils from the Jaffna district. They belonged to the broadening out low middle class comprising petty traders, businessmen, small industrialists, land owners, school teachers and adventurous pensioners. There were also the labourers who found odd jobs in new business enterprises and industries. The towns exhibited a strong masculinity ratio : 145 males to 100 females. The texture of these towns was very loosely woven. Except at the town core where a compact lay-out was exhibited, the surrounding tracts, although within town limits were open with isolated cottages strewn at wide intervals. Brick, tile and even concrete structures were replacingthe semi-permanent and temporary sheds. The upgrading of the existing institutional equipment meant considerable rebuilding and widening of avenues of employment. The towns were thereby gaining a new status to function directly and effectively to the increased activities both within the towns and also in their urban fields. These towns being accessible both by road and railways, supplied with a continuous electricity service, possessed of abundant and cheap land have attracted the location of new agricultural industries such as rice hulling and storing, fertilizers, agricultural machinery and artefacts, and repairs. These activities have widened their urban functional base. 4. THE TOWNS IN THE EASTERN REGION The towns in this region contained about 22 per cent. of the entire urban population of Ceylon Tamils. The region contained the largest number, about 70,000, outside the Jaffna Peninsula. Trincomalee was the largest town with a population of 34,872 of which about 50 per cent., or nearly 18,000 were Ceylon-Tamils. They were particularly concentrated in Puruntheru, Madathadi and Kalikovilady wards. The community appeared to be static whereas the other communities grew steadily. Trincomalee was a net out-migration district especially during 194653 period. People moved out to Batticaloa, Jaffna and Galle. High male out-migration was in the age groups of 27-36 and 37-46 years. Trincomalee town showed a total net out-migration rate of 32.06, the highest among all urban areas. The town's population decreased by 18.9 per cent. Since 1953, town growth was fast, and during 1953-63, it was a prominent in-migration town. The increasing activities at the harbour, its new role as a port of transhipment for the South Indian ports, and cargo port for the Southeast Asian region reactivated the town's commercial, business and industrial activities, and recreated new employment opportunities which exercised centripetal attractions towards it. Recently, it gained a status as a "new regional capital" for the Ceylon-Tamils, and assumed a greater measure of social and economic significance especially in the affairs of the Federal party. Batticaloa was a net in-migration district. In 1953, it drew 1,816 from the Jaffna district, a little less than 10 per cent. of the total in-migrants. About 75 per cent. of Batticaloa town's population comprised of Ceylon-Tamils. They were particularly concentrated in Amurthakali, Power Station, Hospital and Arasadi wards. The new towns of Kalmunai, Katankudy, Eravur and Samanturai recorded a moderate growth rate of 20 per cent. The Ceylon-Tamil population contained in them also increased, and they constituted about 60 per cent. of the total population. These towns developed as service centres and provided prospects for new business and industries. New commercial establishments especially branch offices of the People's Bank, sub-depots of Singer & Co., Bata & Co., new cinema halls, and market premises gave these towns a better status than before. These, although within the ambit of the urban fields of the well established towns of Trincomalee and Batticaloa were in fact competing with them and developing their own urban fields. In the Eastern Region, the growth of these towns and the increasing and effective role of the Ceylon-Tamils in urban affairs were conspicuous indeed. 5. COLOMBO CITY In Colombo was the largest Cevlon-Tamil urban concentration outside the Jaffna Municipality. In 1963, it numbered about 61,500 which was about 12 per cent. of Colombo's urban population, and nearly 20 per cent. of the entire Ceylon-Tamil urban community. Colombo district, particularly Colombo city received 11,446, 7,535 and 18,981 from the Jaffna district for the periods, prior to 1946, 1946-53, and 1953 respectively. The Jaffna-Tamil migration stream to Colombo amounted to about 30 per cent. of the total number of out-migrants from Jaffna district during 1946-53, and nearly 50 per cent. in 1953. Colombo city being the capital, chief port, industrial hub, educational and socio-civic centre exercised centripetal forces encompassing the whole Island. The Ceylon-Tamil immigrants to Colombo were of two types : (a) The middle class type who migrated and settled down in Colombo because of Government employment. Nearly 80 per cent. of the Government departments were located in Colombo. Out of the total of those employed in Government service, Ceylon-Tamil composition was about 35-40 per cent. Some of the upper-middle class settled down for prestigous reasons and to educate their children in Colombo schools. (b) The labour class on the other hand came in search of employment especially found in the harbour and port, the Pettah shopping centre and markets, the municipality, private industries, building enterprises and petty jobs in shops, boutiques and eating houses. The labour class was dispersed in distribution as their places of employment. The in-migration stream especially of the labour class experienced a set-back because of an influx of a large number of Indian-Tamil coolies during 1911-30. But, there was steady and uninterrupted in-migration and settlement of the middle class. After 1930, the growth of the community was rapid, and within the past 20 years, it nearly doubled in numbers. But Colombo's population increased at a faster rate than the rate of increase of this community, consequently their representative percentage, in fact decreased from 16.4 per cent. in 1953 to about 12 per cent. in 1963. Since the Ceylon-Tamil stream consisted of two classes of people, areas of settlement and the nature of communal segmentalization varied. The labour class, predominently male and young was prepared to live as close as possible to their places of work. This resulted in the growth of Ceylon-Tamil pockets in Kochchikade and Kotahena areas,15 which were close to the harbour and the Pettah business centre. Wherever they found work and wherever they found some place to reside which was not beyond their means, they settled down. When they were established in their jobs, they brought their families who were prepared to live in congested tenements. About 25-30 per cent. of the population of Kotahena West and Kochchikade comprised of Ceylon-Tamils. In the wards of Madampitiya, Kotahena East, St. Paul's, Suduwella, Dematagoda, Thimbirigasaya and Kollupitiya, their members exceeded 2,000. The middle class on the other hand lived together 'like the birds of a feather flocking together' in Wellawatte, which was known at that time as the Southern ward. Wellawatte became to be known as "little Jaffna" not because the Ceylon-Tamils constituted an absolute majority group,16 but because of a measure of homogeneity reflected in types of jobs, houses occupied, kith and kin relationships, and similarity in food habits, and other cultural traits. Some from the middle class were able to climb the social ladder mainly as Governmental bureaucrats, specialists in Law, Medicine, Engineering, Accountancy, Education and as rich businessmen. When such a level was reached, they dispersed from Wellawatte and went into residential districts. This section was so `Colombized' that they regarded Jaffna as a holiday home only. However, a cross section of the lower and middle classes, and the students in the higher institutes of learning continued to visit their homes or relations during the week-ends. This movement was facilitated mostly by the express railway services and to a lesser extent, the bus services which operated daily. The recently inaugurated air services appear to be a boon to the businessmen and the administrators. This community in Colombo was well balanced and stable until the communal riots of 1956 which disturbed the feelings of unity and cooperation that existed between the Sinhalese and Ceylon-Tamils. The riots caused a minor exodus from Colombo, some preferred to settle down in their original home environment, while others migrated to the towns north of Colombo. However, the community continued to spearhead all activities from Colombo and played a vital role in both the municipal and national politics. 6. THE TOWNS AROUND COLOMBO Since 1930, and particularly after 1946, the Ceylon-Tamils settled in the towns around Colombo such as Dehiwala-Mount Lavinia, Kotte, Kolonnawa, Wattala-Mobole, Jaela, Negombo and Gampaha. There were several reasons. First, the Government servants of the clerical grades were unable to pay high rents for houses within Colombo municipal limits. They preferred the dormitory towns around the city where houses were available at cheaper rates. Secondly, in those towns north of Colombo, since there was a strong Roman Catholic population, and even some of the people were bilingual, (both Sinhalese and Tamil speaking) the Tamils felt more secure and confident for settlement there. Thirdly, in most of these towns, there were their own countrymen who were prosperous in various enterprises. For instance, in Negombo and Kochchikade and to a lesser extent in others, the entire retail trade was shared by the Ceylon-Tamils and the Tamil speaking Muslims. It was natural then to join their relatives in these places and lend them a helping hand. In these towns, the Ceylon-Tamils were fairly scattered in distribution. However in the Sea Street ward in Negombo, there was a concentration of about 30 per cent. In Kolonnawa town, there was about 12-15 per cent. in each of the wards of Meetotamulla, Urugodawatte and Sedawatte. In the Dehiwala-Mount Lavinia Municipality, there was about 10 per cent. in each of the wards of Dehiwala North, Dehiwala South, and Mount-Lavinia. 7. THE UP-COUNTRY TOWNS The in-migration and settlement in the up-country towns by the Ceylon-Tamils were associated with the vast scale importation of South-Indian cooly labour for the newly opened up coffee, and later tea plantations by the British. While the Indian cooly immigrant was essentially a labourer, the Ceylon-Tamils undertook multifarious activities in the plantation sector, especially in the junction-centres which were collecting centres of plantation produce and distributing centres of foodstuffs, agricultural materials and other artefacts. The majority were employed either as clerks, salesmen, supervisors, attendants or odd job men. With experience, economy and skill, some of them became small land owners. But their children who were educated in English sought jobs elsewhere. In the big towns of Kandy and Matale there was a small resident population of middle class Ceylon-Tamils. As a Tamil speaking group, they were joined by the Indian-Tamils and Muslims all together comprising a powerful pressure group. The Ceylon-Tamils however were self-centered and business conscious and developed their own approach to problems and did not align too closely with the politics and actions of the Indian-Tamil group. Although, the Tamil language was the only common factor for the integration of these Tamil speaking communities, yet politics and economics separated them. The Ceylon-Tamils felt more Ceylonese than the Indian-Tamils, and did not venture to isolate themselves from the Kandyan Sinhalese or to antagonise them. They preserved their identity, although they were ready to adjust to the changing social and regional forces. 8. THE TOWNS IN THE TRANSITIONAL ZONE This zone is transitional and is between the predominant Ceylon-Tamil areas of the Northern Plain (North-west coast and Vanni country), and the predominant Sinhalese areas of the up-country and adjacent South-west country. In Anuradhapura the focus of this region, there was an appreciable number of Ceylon-Tamils, some 4,003 or 21.8 per cent. of its population Anuradhapura's position astride the main highways and railways to Jaffna, Trincomalee and Mannar, coupled with the employment opportunities found there seemed to have drawn the Jaffna folk towards it. The Ceylon-Tamil component in Puttalam was 12.3 per cent. Towards the south, the percentage decreased. For instance, in Kurunagala it was 9.2 per cent, and Chilaw 8.3 per cent. The total population of these towns increased at 35 per cent., but the Ceylon-Tamils increased at 25 per cent. only. 9. THE TOWNS SOUTH OF COLOMBO AND OF THE SOUTHERN REGION Curiously in the towns south of Colombo, the pattern of immigration and settlement of the Ceylon-Tamils exhibited a contrast to the other areas. There were two plausible reasons. First, a more congenial environment was found for their settlement in Colombo city and these towns around it especially to the north of it. Second, the Southerners, who were also as shrewd businessmen as the Jaffna-Tamils, had already occupied these towns and operated business and industry before them. In the Southern towns, there were very small groups of Jaffna-Tamils constituting less than 1 per cent. of the town's population. They were predominantly male, mostly Government employees, or those employed in shops, boutiques or as domestic servants. These Southern towns were taken as a regional unit not merely to show the small numbers, but also to present a contrast with the other urban areas, and emphasize the ubiquitious distribution of Ceylon-Tamils especially in the urban areas of Ceylon. The Jaffna Peninsula experienced a phase of rapid urbanization. Its physical compactness, small size, transport efficiency, population increase, administrative reorganisation and modernization policies, especially rural electrification, industrialization, and rural development, all taken together intensified the urbanization process." Urban influences spread out very effectively to the countryside because most of the villages were within the ambit of the spheres of influence of towns, and were within an hour's driving distance from the towns. Within the next decade, it is likely that about 40 per cent. of the total population in the Jaffna Peninsula may live in urban areas. The Ceylon-Tamils will continue to play a predominant role in urban affairs in the Jaffna Peninsula, and in the Northern Plain, although they are likely to face competition from the other Tamil speaking communities, especially the Muslims and Indian-Tamils. In the Eastern Region, the Tamil speaking Muslims have been and are serious competitors. It is likely that owing to colonization, land development and rural resettlement schemes in the Eastern Province, the rural component of the Ceylon-Tamil population may increase. The Ceylon-Tamils are also likely to increase their interest and activities in this region, and integrate it as far as they can with the Jaffna Region. In Colombo city, although the Ceylon-Tamils are only 12 per cent. of its total population, their economic impact is very significant. In respect of ownership of land, houses, business establishments, they are only second to the Sinhalese. In retail trade, they hold about 30 per cent. of the retail stores, shops, etc., either as sole owners or in partnerships or in shares." They seem to prefer towns to the north of Colombo. Their immigration and settlement in these towns and the gradual appearance of 'communal housing areas', are emerging trends. In the upcountry towns, their business, commerce and trade, are large and are comparable to the business activities of the Muslim community. These two communities together monopolise the commerce of these towns. However, these towns do not seem to attract large numbers of Ceylon-Tamils for settlement. The existing policy of education in the swabhasha does seem to effect a complete separation of the Sinhalese and Tamils in educational institutions, including the seats of higher learning and research. This inevitable separation and isolationism of the community are perhaps impediments to their free movement and activities especially in the Sinhalese predominant regions. In politics, by the official Language Act of 1956, it is incumbent on the Tamils to learn Sinhalese as a prerequisite for Governmental employment. Unless the Tamils are willing to study Sinhalese, it appears that the community would face restricted employment, restricted mobility and disperson in the Sinhalese areas. The recently passed Tamil Language Special Provisions Act of 1966 however, intends to give official status to the Tamil Language in the North and Eastern areas. This Act is very likely to revive the use of the Tamil language in educational, cultural, local Government affairs and in public relations in these two areas. Language and politics do not appear to be so favourable to the Ceylon-Tamils as these were under the British regime. But, a liberal mind to accept the sweeping changes of the times, a desire to learn the official language despite its limited utility values, a spirit of compromise, although perhaps it may be painful, may be wanting from, and expected of the Ceylon-Tamils. The majority community (Sinhalese) just cannot afford to ignore or side track this industrious, hardworking resourceful and capable community because they played a significant role in all national affairs during the past, and shall continue to play a similar role in the future. The efforts of the present National Government in restoring amity and goodwill among the various communities, and efforts to build a united nation are praiseworthy.
1 The word 'community' instead of 'race' is preferred in the text because there exist only slight differences between these ethnic groups. Throughout the text. Ceylon-Tamil and Jaffna-Tamil refer to the same group of persons. 2As a linguistic group, this would comprise about 28-30 per cent. of the total population of Ceylon. 3 The terms 'Moor' and 'Muslim', although used differently, refer to the same 'Muslim community' (followers of Prophet Mohamed, or religion known as Islam). 4 The Census of 1953 recorded the following ranking :
Source : Census of Ceylon, 1953, Vol. 1. 5 The date 1911 is chosen because the Census of 1911 for the first time differentiated between Ceylon-Tamils and Indian-Tamils. 6 The Census of 1963 is not yet published. Figures quoted for 1963 are either estimated or computed. 7 These are those classified for Local Government administration. They are, the Municipality of Jaffna, the Urban Council of Point Pedro and the Town Councils of Chavakachcheri, Kankesanturai, Valvettiturai, Manipay, Kayts and Chankanai. 8 The depressed birth rates recorded within an interval of a year (37.8 in 1963 dropped to 30 in 1964) are a new demographic trend reflecting the successful work of the Family Planning Association in the Jaffna Municipality. 9 The absence of surface drainage in the Peninsula is due to the underlying geological strata of limestone. The underlying limestone is a good acquifer, yielding the necessary quantity of water drawn from the walls. 10 'Supplementary Report on Housing', Census of Ceylon, 1953 (from Tables 6 and 7). 11 W. L. Jayasingham, "The Urban Geography of Jaffna", Ph.D. Dissertation, 1958 (unpublished) Clark University, U.S.A. 12 Ibid. W. L. Jayasingham. 13 The educated Melongi-Karawar gave up the traditional occupation (fishing), whereas the Kelongi-Karawar still are fishermen. 14 It is estimated that a lacham (one-sixteenth part of an acre) in the core area (Jaffna city) costs about Rs. 20,000. In good residential areas, where water is available and are not subject to floods, a lacham is about Rs. 15,000-12,000. Even the marginal land is about Rs. 10,000-8,000 a lacham. 15 In the Kotahena West ward, out of a total population of 16,502, Ceylon-Tamils numbered 4,327. In the Kochchikade ward, out of a total of 11,845 Ceylon-Tamils numbered 3,388 (1963 data). 16 Wellawatta's unofficial but popular nomenclature as "Little Jaffna" is a misnomer from the point of view of the numbers of Ceylon-Tamils. For instance, in the Wellawatta North ward, there were only 2,216 Ceylon-Tamils out of a total population of 15,280. In the Wellawatta South ward, they numbered 3,894 out of a total population of 14,305 (1963 data). 17 For a general survey of the urbanization of Ceylon, refer B. L. Panditharatna, "Trends of Urbanization in Ceylon, 1901-1953" The Ceylon Journal of Historical and Social Studies, Vol. 7, No. 2, July-December, 1964. 18 The Ferguson's Directory, 1965 supplies a list of registered business establishments. It was possible to arrive at these figures, after studying the list in detail.
|
||||||||||||||||||||||||||||||||||||||||||||||||||||||||||||||||||||||||||||||||||||||||||||||||||||||||||||||||||||||||||||||||||||||||||||||||||||||||||||||||||||||||||||||||||||||||||||||||||||||||||